STEM-AND-LEAF DISPLAYS
Definition
In a stem-and-leaf display of quantitative data, each value is divided into two portions – a stem and a leaf. The leaves for each stem are shown separately in a display.
Example 2-8
The following are the scores of 30 college students on a statistics test:
|
75 69 83 |
52 72 84 |
80 81 77 |
96 61 64 |
65 76 71 |
79 86 87 |
71 79 72 |
87 68 92 |
93 50 57 |
95 92 98 |
Construct a stem-and-leaf display.
Solution 2-8
To construct a stem-and-leaf display for these scores, we split each score into two parts. The first part contains the first digit, which is called the stem. The second part contains the second digit, which is called the leafn
Solution 2-8
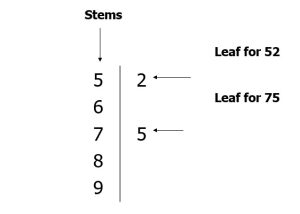
We observe from the data that the stems for all scores are 5, 6, 7, 8, and 9 because all the scores lie in the range 50 to 98.
Figure 2.13 Stem-and-leaf display.
Solution 2-8
After we have listed the stems, we read the leaves for all scores and record them next to the corresponding stems on the right side of the vertical line.
Figure 2.14 Stem-and-leaf display of test scores.
|
5 6 7 8 9 |
2 0 7 5 9 1 8 4 5 9 1 2 6 9 7 1 2 0 7 1 6 3 4 7 6 3 5 2 2 8 |
Figure 2.15 Ranked stem-and-leaf display of test scores.
|
5 6 7 8 9 |
0 2 7 1 4 5 8 9 1 1 2 2 5 6 7 9 9 0 1 3 4 6 7 7 2 2 3 5 6 8 |
Example 2-9
The following data are monthly rents paid by a sample of 30 households selected from a small city.
|
880 1210 1151 |
1081 985 630 |
721 1231 1175 |
1075 932 952 |
1023 850 1100 |
775 825 1140 |
1235 1000 750 |
750 915 1140 |
965 1191 1370 |
960 1035 1280 |
Construct a stem-and-leaf display for these data.
Solution 2-9
Figure 2.16 Stem-and-leaf display of rents.
|
6 7 8 9 10 11 12 13 |
30 75 50 21 50 80 25 50 32 52 15 60 85 65 23 81 35 75 00 91 51 40 75 40 00 10 31 35 80 70 |
Example 2-10
The following stem-and-leaf display is prepared for the number of hours that 25 students spent working on computers during the last month.
Example 2-10
|
0 1 2 3 4 5 6 7 8 |
6 1 7 9 2 6 2 4 7 8 1 5 6 9 9 3 6 8 2 4 4 5 7 5 6 |
Prepare a new stem-and-leaf display by grouping the stems.
Solution 2-10
Figure 2.17 Grouped stem-and-leaf display.
|
0 – 2 3 – 5 6 – 8 |
6 * 1 7 9 * 2 6 2 4 7 8 * 1 5 6 9 9 * 3 6 8 2 4 4 5 7 * * 5 6 |