- Data: consists of information coming from observations, counts, measurements, or responses
- Statistics: is the science of collecting, organizing, analyzing, and interpreting data in order to make decisions.
Population: a population consist of all subjects that are being studied.
Sample: a sample is a group of subjects selected from population
- A census is a measurement of an entire population.
A sampling is a measurement of part of a population.
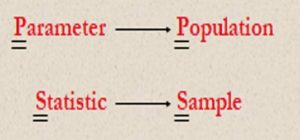
- Parameter: is a numerical description of a population characteristics
- statistic is a numerical description of a sample characteristic.
Example:
- Decide whether the numerical value describes a population parameter or a sample statistic.
- A recent survey of a sample of 450 college students reported that the average weekly income for students is $325.
- Because the average of $325 is based on a sample, this is a sample statistic.
- The average weekly income for all students is $405.
- Because the average of $405 is based on a population, this is a population parameter.
Branches of Statistics:
The study of statistics has two major branches: descriptive statistics and inferential statistics.
- Descriptive statistics:
Involves the organization, summarization, and display of data
- Inferential statistics:
Involves using a sample to draw conclusions about a population
DATA/ VARAIBLES CLASSIFICATION:
Data timing: Time Series, Cross Sectional and Panel/Pooled,
Data type: Qualitative and Quantitative .
Data Level: Qualitative (Nominal and Ordinal) Quantitative (Ratio and interval = Scale).
- Time series data: refers to the data collected at several successive point of time.
- Cross sectional data: is data collected at the same or approximately the same point of time.
- Panel: Combined time series and cross sectional features
- Qualitative data: is data that can be placed into distinct categories, according to the same characteristics or attribute. For example if the subject are classified according to gender( male, female) than it is qualitative.
- ØQuantitative data : quantitative data are numeric and can be ordered or ranked. for example age is quantitative data and can be ranked according to the values of their ages, height, weight at temperature are classified into quantitative data.
Quantitative data can be classified into two groups
- Discrete data : such as1, 2, 3, means can be counted for example we can count the number of children in a family, the number of students in class room.
- Continues data : such as data that includes fractions, decimals, so we assume infinite numbers between any two specific values , for example temperature is continues data since the difference between any two given temperature is infinite.
qualitative quantitative
- Deals with description. deals with numbers.
- Data can be observed not. data can be measured.
- Measured colors, tests, height, length, weight, temperature.
- appearance, beauty etc.
- Ratio: a ratio data has tree properties
1.Ratio of two variables: Y1/Y2
2.Distance between two variables:Y1-Y2
3.Ordering of variables or ranking of variables Y1>Y2, Y1<Y2
- Interval data: interval data do not satisfy the first property of ratio data but satisfies the other two properties.
- Ordinal data : ordinal data satisfies only ordering or ranking properties of ratio data, but do not satisfies the other two properties.
- Nominal data: nominal data do not satisfies any properties of ratio data means do not have any features of ratio data.
NOTE there is difference between nominal and binary data
Nominal data: includes more than two categories e.g. Martial status.
Binary data: includes only two categories e.g. gender (male, female).
Other classification of data(Variables)
Variables can be split into categorical and continuous, and within these types there are different levels of measurement:
Variables: Categorical and Continuous.
Level of measurement: Categorical (Nominal, Binary and Ordinal) Continuous (Ratio and Interval).
- categorical (entities are divided into distinct categories): Binary variable: There are only two categories (e.g. dead or alive).
- Nominal variable: There are more than two categories e.g. Martial status.
- Ordinal variable: The same as a nominal variable but the categories have a logical order (e.g. whether people got a fail, a pass, a merit or a distinction in their exam).
Continuous (entities get a distinct score):
- Interval variable: Equal intervals on the variable represent equal differences in the property being measured (e.g. the difference between 6 and 8 is equivalent to the difference between 13 and 15).
- Ratio variable: The same as an interval variable, but the ratios of scores on the scale must also make sense (e.g. a score of 16 on an anxiety scale means that the person is, in reality, twice as anxious as someone scoring 8).