ORGANIZING AND GRAPHING QUANTITATIVE DATA
- Frequency Distributions
- Constructing Frequency Distribution Tables
- Relative and Percentage Distributions
- Graphing Grouped Data
- Histograms
- Polygons
Frequency Distributions
Table 2.7 Weekly Earnings of 100 Employees of a Company.
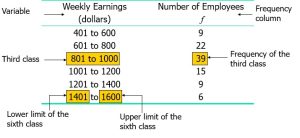
Frequency Distributions cont.
Definition
A frequency distribution for quantitative data lists all the classes and the number of values that belong to each class. Data presented in the form of a frequency distribution are called grouped data.
Definition
The class boundary is given by the midpoint of the upper limit of one class and the lower limit of the next class.
Finding Class Width
Class width = Upper boundary – Lower boundary
Calculating Class Midpoint or Mark
Class Mid pointer mark = Lower limit + Upper limit / 2
Calculation of Class Width
Approximate class width = Largest Value – Smallest value / Number of classes
Table 2.8 Class Boundaries, Class Widths, and Class Midpoints for Table 2.7
|
Class Limits |
Class Boundaries |
Class Width |
Class Midpoint |
|
401 to 600 601 to 800 801 to 1000 1001 to 1200 1201 to 1400 1401 to 1600 |
400.5 to less than 600.5 600.5 to less than 800.5 800.5 to less than 1000.5 1000.5 to less than 1200.5 1200.5 to less than 1400.5 1400.5 to less than 1600.5 |
200 200 200 200 200 200 |
500.5 700.5 900.5 1100.5 1300.5 1500.5 |
Example 2-3
Table 2.9 gives the total home runs hit by all players of each of the 30 Major League Baseball teams during the 2002 season. Construct a frequency distribution table.
Table 2.9 Home Runs Hit by Major League Baseball Teams During the 2002 Season
|
Team |
Home Runs |
Team |
Home Runs |
|
Anaheim Arizona Atlanta Baltimore Boston Chicago Cubs Chicago White Sox Cincinnati Cleveland Colorado Detroit Florida Houston Kansas City Los Angeles |
152 165 164 165 177 200 217 169 192 152 124 146 167 140 155 |
Milwaukee Minnesota Montreal New York Mets New York Yankees Oakland Philadelphia Pittsburgh St. Louis San Diego San Francisco Seattle Tampa Bay Texas Toronto |
139 167 162 160 223 205 165 142 175 136 198 152 133 230 187 |
Solution 2-3
Approximate width of each class = 230-124/5 = 21.2
Now we round this approximate width to a convenient number-say, 22.
Solution 2-3
The lower limit of the first class can be taken as 124 or any number less than 124. Suppose we take 124 as the lower limit of the first class. Then our classes will be
124 – 145, 146 – 167, 168 – 189, 190 – 211,
and 212 – 233
Table 2.10 Frequency Distribution for the Data of Table 2.9
|
Total Home Runs |
Tally |
f |
|
124 – 145 146 – 167 168 – 189 190 – 211 212 – 233 |
|||| | |||| |||| ||| |||| |||| ||| |
6 13 4 4 3 |
|
∑f = 30 |
n