Correlation
Finding the relationship between two quantitative variables without being able to infer causal relationships
Correlation is a statistical technique used to determine the degree to which two variables are related.
Scatter diagram
- Rectangular coordinate
- Two quantitative variables
- One variable is called independent (X) and the second is called dependent (Y)
- Points are not joined
- No frequency table
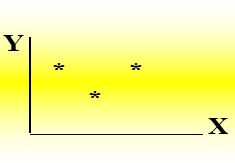
Example
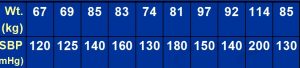
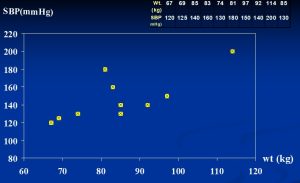
Scatter diagram of weight and systolic blood pressure
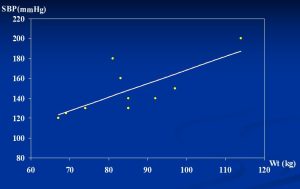
Scatter diagram of weight and systolic blood pressure
Scatter plots
The pattern of data is indicative of the type of relationship between your two variables:
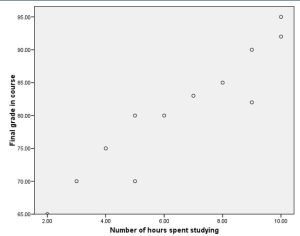
- positive relationship
- negative relationship
- no relationship
Positive relationship
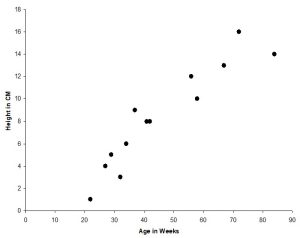
Negative relationship
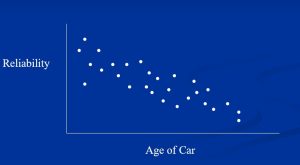
No relation
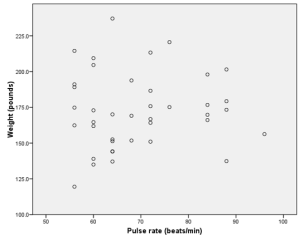
Correlation Coefficient
Statistic showing the degree of relation between two variables
Simple Correlation coefficient (r)
- It is also called Pearson’s correlation or product moment correlation
coefficient. - It measures the nature and strength between two variables of
the quantitative type.
- The sign of r denotes the nature of association
- while the value of r denotes the strength of association.
- If the sign is +ve this means the relation is direct (an increase in one variable is associated with an increase in the
other variable and a decrease in one variable is associated with a
decrease in the other variable). - While if the sign is -ve this means an inverse or indirect relationship (which means an increase in one variable is associated with a decrease in the other).
- The value of r ranges between ( -1) and ( +1)
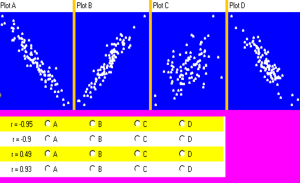
- The value of r denotes the strength of the association as illustrated
by the following diagram.
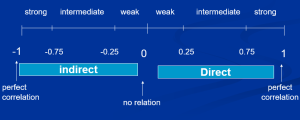
- If r = Zero this means no association or correlation between the two variables.
- If 0 < r < 0.25 = weak correlation.
- If 0.25 ≤ r < 0.75 = intermediate correlation.
- If 0.75 ≤ r < 1 = strong correlation.
- If r = l = perfect correlation.
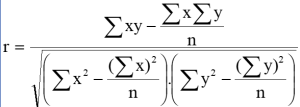
How to compute the simple correlation coefficient (r)
Example:
A sample of 6 children was selected, data about their age in years and weight in kilograms was recorded as shown in the following table . It is required to find the correlation between age and weight.
|
Weight (Kg) |
Age (years) |
serial No |
|
12 |
7 |
1 |
|
8 |
6 |
2 |
|
12 |
8 |
3 |
|
10 |
5 |
4 |
|
11 |
6 |
5 |
|
13 |
9 |
6 |
These 2 variables are of the quantitative type, one variable (Age) is called the independent and denoted as (X) variable and the other (weight)
is called the dependent and denoted as (Y) variables to find the relation between age and weight compute the simple correlation coefficient using the following formula:
|
Y2 |
X2 |
xy |
Weight (Kg) (y) |
Age (years) (x) |
Serial n. |
|
144 |
49 |
84 |
12 |
7 |
1 |
|
64 |
36 |
48 |
8 |
6 |
2 |
|
144 |
64 |
96 |
12 |
8 |
3 |
|
100 |
25 |
50 |
10 |
5 |
4 |
|
121 |
36 |
66 |
11 |
6 |
5 |
|
169 |
81 |
117 |
13 |
9 |
6 |
|
∑y2= 742 |
∑x2= 291 |
∑xy= 461 |
∑y= 66 |
∑x= 41 |
Total |
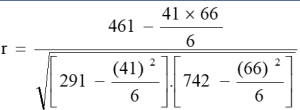
r = 0.759
strong direct correlation
EXAMPLE:
Relationship between Anxiety and Test Scores
|
Anxiety (X) |
Test score (Y) |
X2 |
Y2 |
XY |
|
10 |
2 |
100 |
4 |
20 |
|
8 |
3 |
64 |
9 |
24 |
|
2 |
9 |
4 |
81 |
18 |
|
1 |
7 |
1 |
49 |
7 |
|
5 |
6 |
25 |
36 |
30 |
|
6 |
5 |
36 |
25 |
30 |
|
∑X = 32 |
∑Y = 32 |
∑X2 = 230 |
∑Y2 = 204 |
∑XY=129 |
Calculating Correlation Coefficient

r = – 0.94
Indirect strong correlation
Spearman Rank Correlation Coefficient (rs)
- It is a non-parametric measure of correlation.
- This procedure makes use of the two sets of ranks that may be assigned to the sample values of x and Y.
- Spearman Rank correlation coefficient could be computed in the following cases:
- Both variables are quantitative.
- Both variables are qualitative ordinal.
- One variable is quantitative and the other is qualitative ordinal.
Procedure:
- .Rank the values of X from 1 to n where n is the numbers of pairs of values of X and Y in the sample.
- .Rank the values of Y from 1 to n.
- Compute the value of di for each pair of observation by subtracting the rank of Yi from the rank of Xi
- Square each di and compute ∑di2 which is the sum of the squared values.
- Apply the following formula
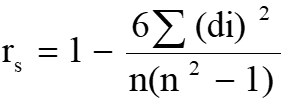
- The value of rs denotes the magnitude and nature of association giving the same interpretation as simple r.
Example
In a study of the relationship between level education and income the following data was obtained. Find the relationship between them and comment.
|
Income |
level education |
sample |
|
25 |
Preparatory. |
A |
|
10 |
Primary. |
B |
|
8 |
University. |
C |
|
10 |
secondary |
D |
|
15 |
secondary |
E |
|
50 |
illiterate |
F |
|
60 |
University. |
G |
Answer:
|
di2 |
di |
Rank |
Rank |
(Y) |
(X) |
|
|
4 |
2 |
3 |
5 |
25 |
Preparatory |
A |
|
0.25 |
0.5 |
5.5 |
6 |
10 |
Primary. |
B |
|
30.25 |
-5.5 |
7 |
1.5 |
8 |
University. |
C |
|
4 |
-2 |
5.5 |
3.5 |
10 |
secondary |
D |
|
0.25 |
-0.5 |
4 |
3.5 |
15 |
secondary |
E |
|
25 |
5 |
2 |
7 |
50 |
illiterate |
F |
|
0.25 |
0.5 |
1 |
1.5 |
60 |
university. |
G |
∑ di2=64
Comment:
There is an indirect weak correlation between level of education and income.
exercise