Regression Analyses
- Regression: technique concerned with predicting some variables by knowing others
- The process of predicting variable Y using variable X
Regression
- Uses a variable (x) to predict some outcome variable (y)
- Tells you how values in y change as a function of changes in values of x
Correlation and Regression
- Correlation describes the strength of a linear relationship between two variables
- Linear means “straight line”
- Regression tells us how to draw the straight line described by the correlation
Regression
ØCalculates the “best-fit” line for a certain set of data
The regression line makes the sum of the squares of the residuals smaller than for any other line
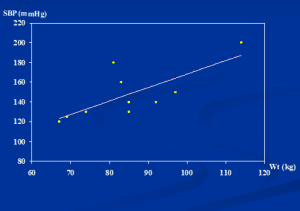
Regression minimizes residuals
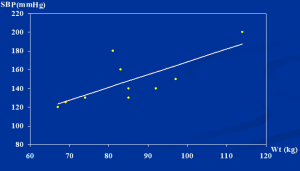
By using the least squares method (a procedure that minimizes the vertical deviations of plotted points surrounding a straight line) we are
able to construct a best fitting straight line to the scatter diagram points and then formulate a regression equation in the form of:
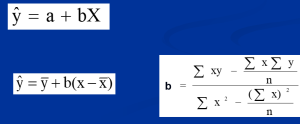
Regression Equation
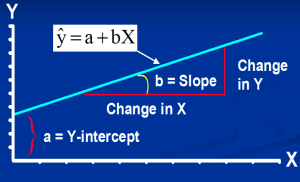
- Regression equation describes the regression line mathematically
- Intercept
- Slope
Linear Equations
Hours studying and grades
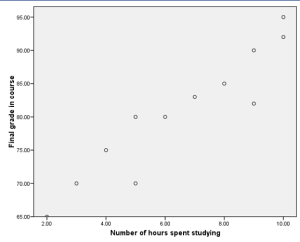
Regressing grades on hours
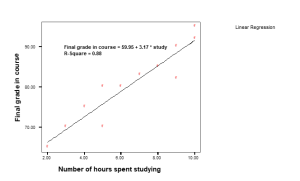
Predicted final grade in class =
59.95 + 3.17*(number of hours you study per week).
Predicted final grade in class = 59.95 + 3.17*(hours of study)
Predict the final grade of…
- Someone who studies for 12 hours
- Final grade = 59.95 + (3.17*12)
- Final grade = 97.99
- Someone who studies for 1 hour:
- Final grade = 59.95 + (3.17*1)
- Final grade = 63.12
Exercise
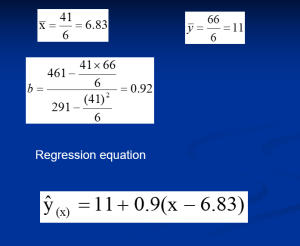
A sample of 6 persons was selected the value of their age ( x variable) and their weight is demonstrated in the following table. Find the regression equation and what is the predicted weight when age is 8.5 years.
|
Weight (y) |
Age (x) |
Serial no. |
||||||
|
12 8 12 10 11 13 |
7 6 8 5 6 9 |
1 2 3 4 5 6
|
Answer
|
Y2 |
X2 |
xy |
Weight (y) |
Age (x) |
Serial no. |
|
144 64 144 100 121 169 |
49 36 64 25 36 81 |
84 48 96 50 66 117 |
12 8 12 10 11 13 |
7 6 8 5 6 9 |
1 2 3 4 5 6 |
|
742 |
291 |
461 |
66 |
41 |
Total |
 ;
;
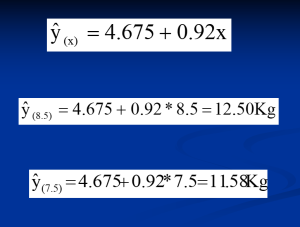
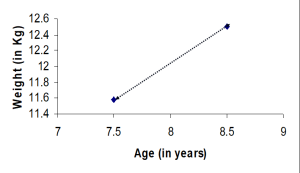
we create a regression line by plotting two estimated values for y against their X component, then extending the line right and left.
Exercise 2
The following are the age (in years) and systolic blood pressure of 20 apparently healthy adults.
|
B.P (y) |
Age (x) |
B.P (y) |
Age (x) |
|
128 136 146 124 143 130 124 121 126 123 |
46 53 60 20 63 43 26 19 31 23 |
120 128 141 126 134 128 136 132 140 144 |
20 43 63 26 53 31 58 46 58 70 |
- Find the correlation between age and blood pressure using simple and Spearman’s correlation coefficients, and comment.
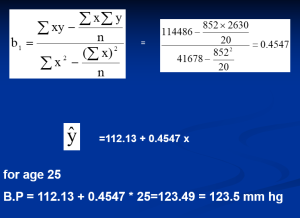
- Find the regression equation?
- What is the predicted blood pressure for a man aging 25 years?
|
x2 |
xy |
y |
x |
Serial |
|
400 |
2400 |
120 |
20 |
1 |
|
1849 |
5504 |
128 |
43 |
2 |
|
3969 |
8883 |
141 |
63 |
3 |
|
676 |
3276 |
126 |
26 |
4 |
|
2809 |
7102 |
134 |
53 |
5 |
|
961 |
3968 |
128 |
31 |
6 |
|
3364 |
7888 |
136 |
58 |
7 |
|
2116 |
6072 |
132 |
46 |
8 |
|
3364 |
8120 |
140 |
58 |
9 |
|
4900 |
10080 |
144 |
70 |
10 |
|
x2 |
xy |
y |
x |
Serial |
|
2116 |
5888 |
128 |
46 |
11 |
|
2809 |
7208 |
136 |
53 |
12 |
|
3600 |
8760 |
146 |
60 |
13 |
|
400 |
2480 |
124 |
20 |
14 |
|
3969 |
9009 |
143 |
63 |
15 |
|
1849 |
5590 |
130 |
43 |
16 |
|
676 |
3224 |
124 |
26 |
17 |
|
361 |
2299 |
121 |
19 |
18 |
|
961 |
3906 |
126 |
31 |
19 |
|
529 |
2829 |
123 |
23 |
20 |
|
41678 |
114486 |
2630 |
852 |
Total |
Multiple Regression
Multiple regression analysis is a straightforward extension of simple regression analysis which allows more than one independent variable.