Definition
A cumulative frequency distribution gives the total number of values that fall below the upper boundary of each class.
Example 2-7
Using the frequency distribution of Table 2.10, reproduced in the next slide, prepare a cumulative frequency distribution for the home runs hit by Major League Baseball teams during the 2002 season.
Example 2-7
|
Total Home Runs |
f |
|
124 – 145 146 – 167 168 – 189 190 – 211 212 – 233 |
6 13 4 4 3 |
Solution 2-7
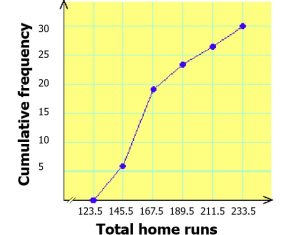
Table 2.14 Cumulative Frequency Distribution of Home Runs by Baseball Teams
|
Class Limits |
Class Boundaries |
Cumulative Frequency |
|
124 – 145 124 – 167 124 – 189 124 – 211 124 – 233 |
123.5 to less than 145.5 123.5 to less than 167.5 123.5 to less than 189.5 123.5 to less than 211.5 123.5 to less than 233.5 |
6 6 + 13 = 19 6 + 13 + 4 = 23 6 + 13 + 4 + 4 = 27 6 + 13 + 4 + 4 + 3 = 30 |
CUMULATIVE FREQUENCY DISTRIBUTIONS cont.
Calculating Cumulative Relative Frequency and Cumulative Percentage.
- Cumulative relative frequency = Cumulative Frequency of a class / Total observations in the date set
- Cumulative percentage = (Cumulative Relative frequency) .100
Table 2.15 Cumulative Relative Frequency and Cumulative Percentage Distributions for Home Runs Hit by baseball Teams.
|
Class Limits |
Cumulative Relative Frequency |
Cumulative Percentage |
|
124 – 145 124 – 167 124 – 189 124 – 211 124 – 233 |
6/30 = .200 19/30 = .633 23/30 = .767 27/30 = .900 30/30 = 1.00 |
20.0 63.3 76.7 90.0 100.0 |
CUMULATIVE FREQUENCY DISTRIBUTIONS cont.
Definition
An ogive is a curve drawn for the cumulative frequency distribution by joining with straight lines the dots marked above the upper boundaries of classes at heights equal to the cumulative frequencies of respective classes.
Figure 2.12 Ogive for the cumulative frequency distribution in Table 2.14